 Insights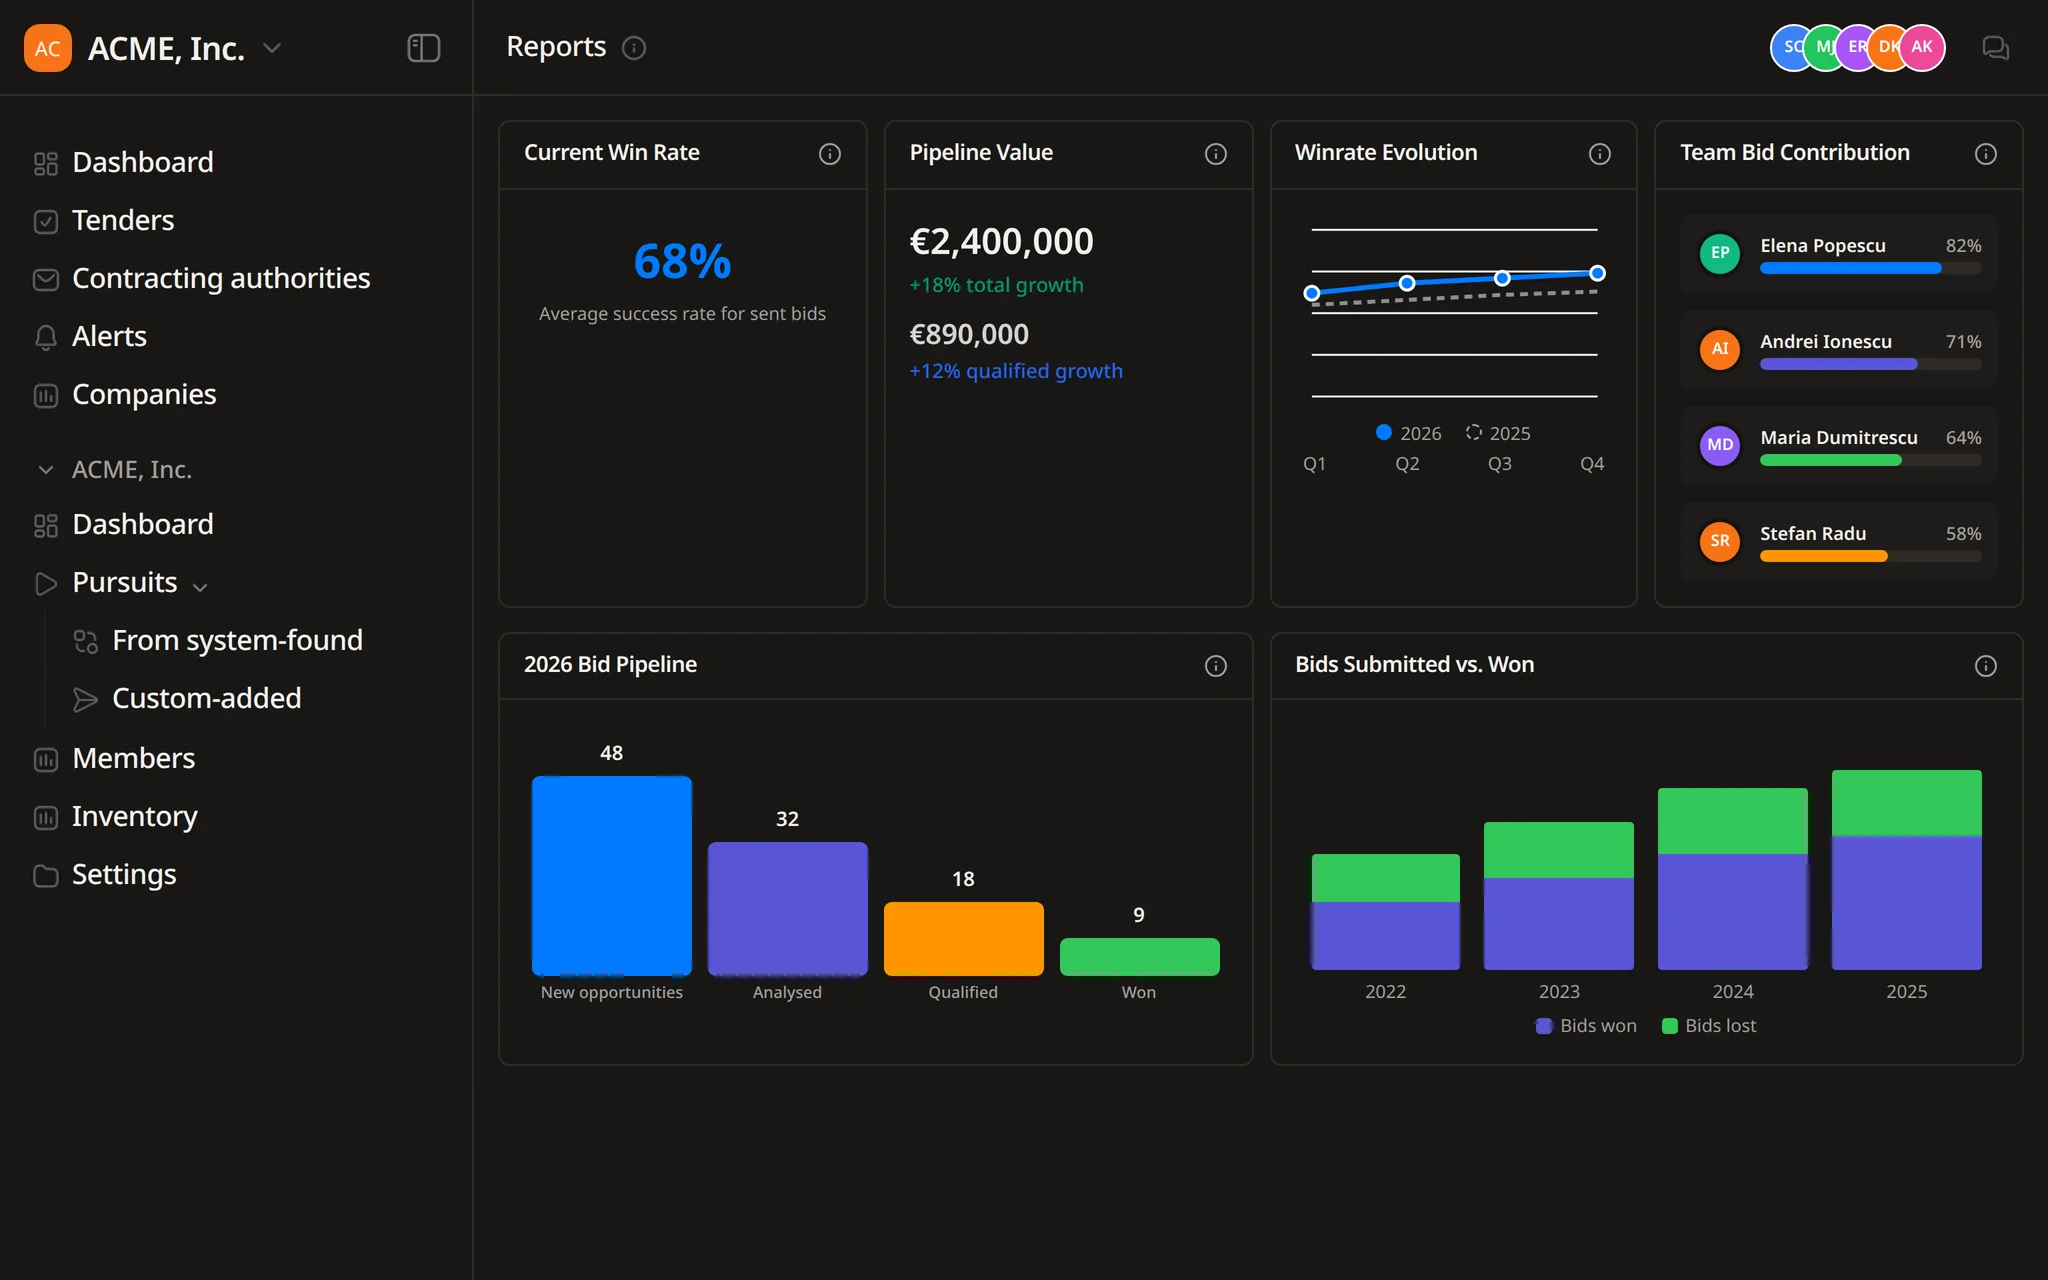
A weekly pipeline summary
Flow runs the task every Monday and each run opens its own thread, so the team reads the same figures.


Find opportunities, choose which ones to pursue, prepare the response, and track the deadline.
Search notices, buyers, and CPV codes. Save useful searches and keep deadlines in view.
Improve text, translate it, remove sensitive details, or fill a template, then review each change in the same Word file.
Get notified when a relevant tender appears. Check the details, keep deadlines in view, and decide what needs attention next.
 Insights
Insights shows what your team submits and wins. Flow, the Tendersight agent, answers questions about the numbers and summarises them on a schedule.
Win rate from submitted and won bids
Total and qualified pipeline value
Answers grounded in your data
The overview shows the numbers. Flow answers the questions behind them.
Ask about your pipeline, a buyer or a competitor. Flow reads your pursuits and public procurement data and replies with figures, a chart or a file that lists its sources.
The same questions come back every week, from the team and from management.
How many submitted bids were won, and how the rate moves from quarter to quarter.
What is in play, in total and after qualification.
What closes in the next seven days, and how complete each bid is.
Who submitted which bids over the year.
Which contracting authorities buy what you sell, and how often they publish.
Who bids on the same CPV codes, and where they win.
The overview holds the charts. Flow answers the questions around them and prepares the review.
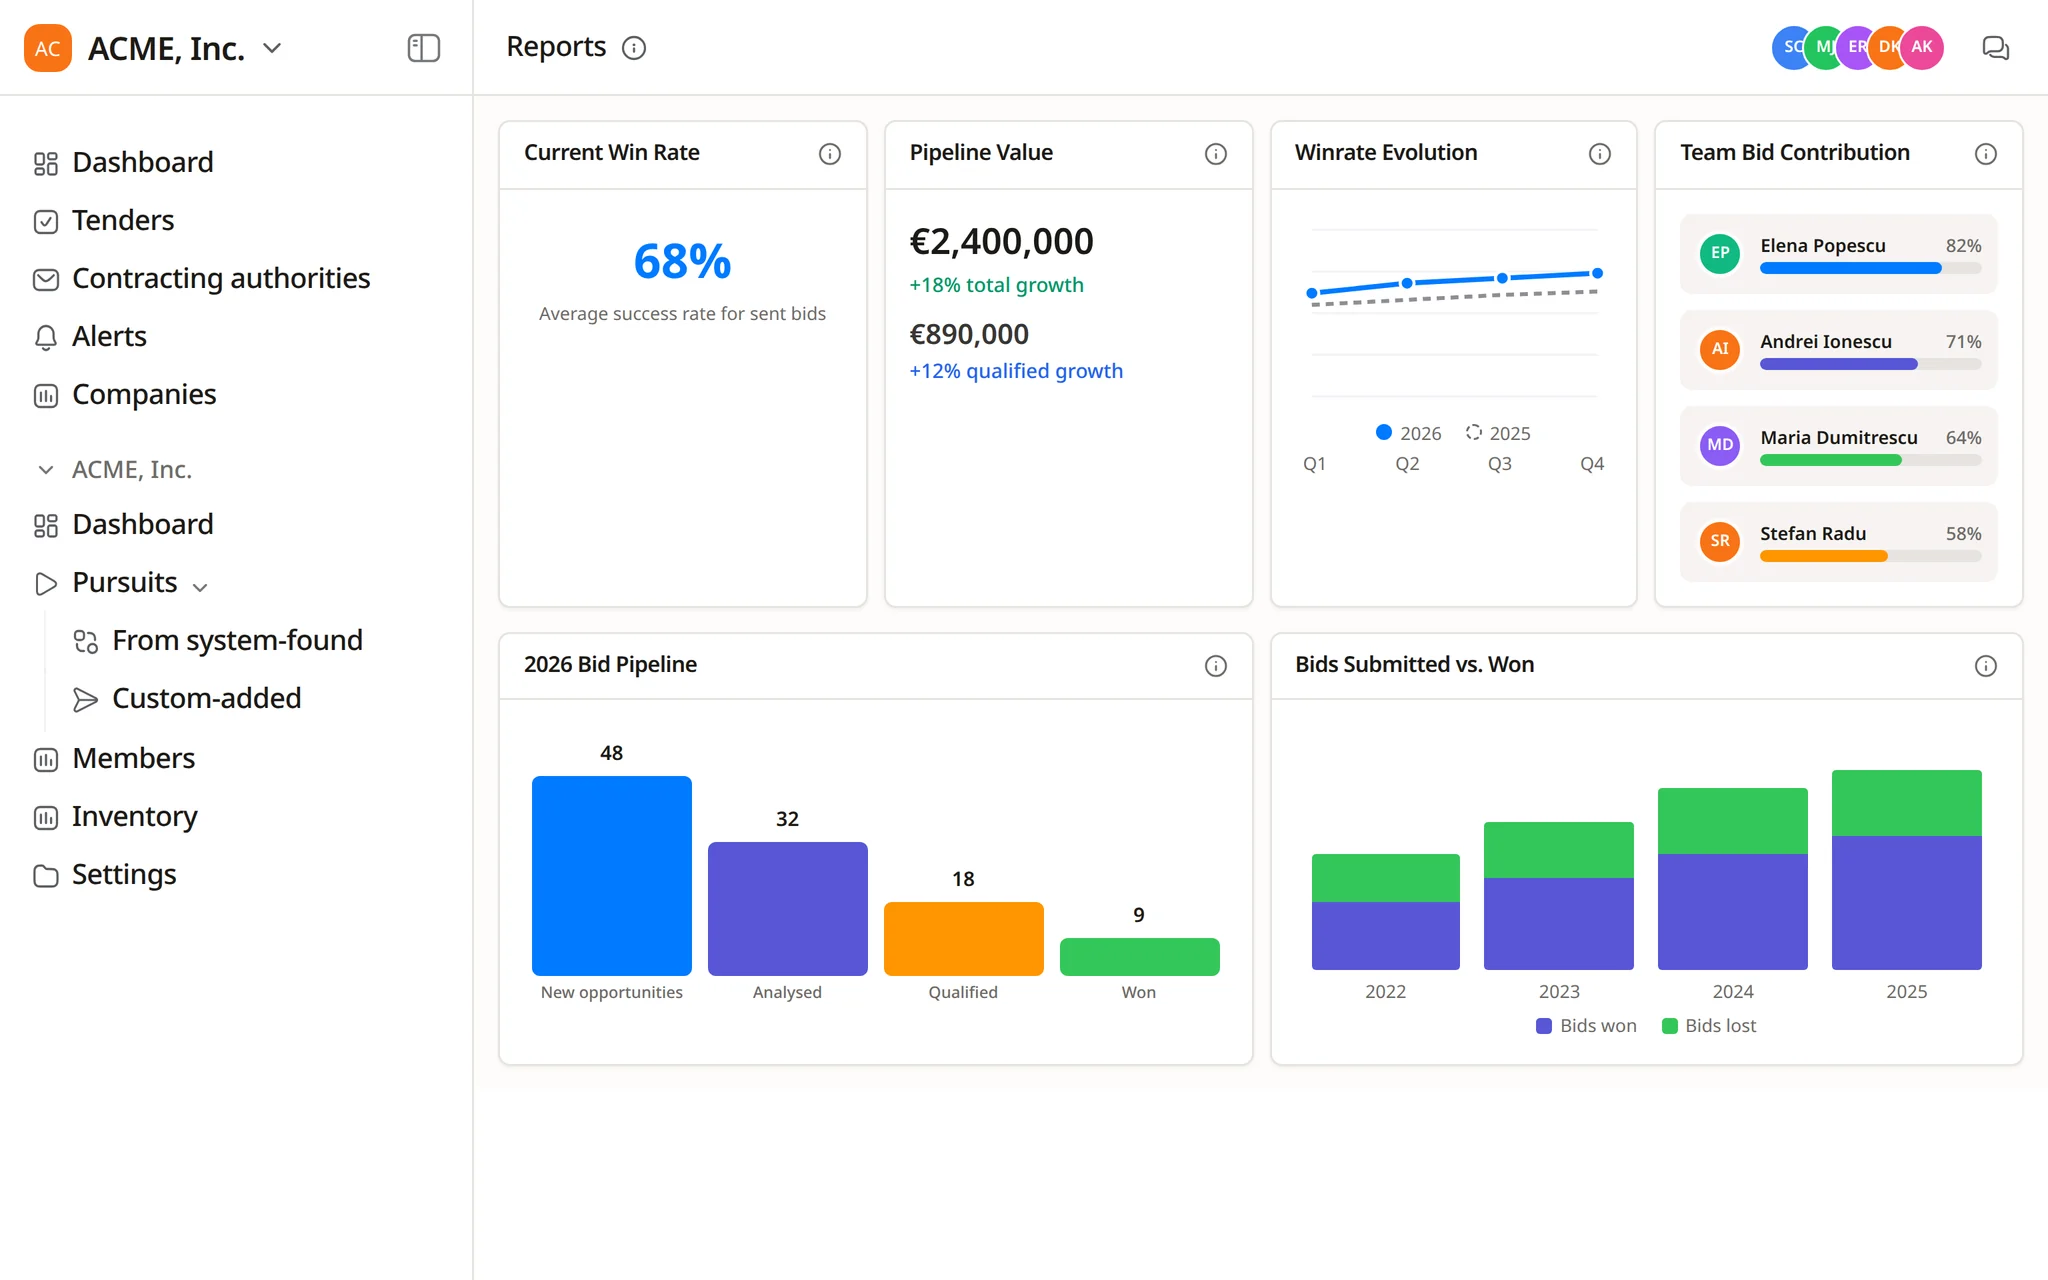
Win rate, pipeline value, win rate by quarter, team bid contribution, the bid pipeline from new to won, and bids submitted against won.
Ask in plain words. Flow reads your team's pursuits and answers in the conversation with figures and a chart grounded in that data.
Flow reads contracting authority and company statistics: frequent CPV codes, market share, regional coverage, main competitors and participation over time.
Flow produces the review as Excel, PDF or Word. Spreadsheets list their sources and assumptions, and each file is marked internal working.
For a quarterly review Flow writes the plan first, gives research to side agents and waits for your approval before it starts.
Examples from sales and bid managers who report on public sector sales.
Summarise our pipeline by stage and show the qualified value for Q4.
Chart our win rate by quarter for this year and last year.
Show the contracting authority statistics for the Vienna hospital association and the CPV codes it buys most.
Who are the main competitors on CPV 90910000 in Austria, and how has their participation changed since 2023?
Every Monday at 08:00, summarise the pursuits due in the next 7 days and their completion.
Build a spreadsheet of this year's won and lost bids with their estimated values, and list the sources.
Weekly summaries, buyer research and the figures management asks for, each set up in a conversation.
Flow runs the task every Monday and each run opens its own thread, so the team reads the same figures.
Ask for a buyer's tenders by name. Flow filters the catalogue by contracting authority, value and deadline.
Win rate and pipeline value come from each pursuit's status and estimated value. Keep them current and the reports stay accurate.
Standalone pursuits without an estimated value are left out of pipeline totals. Flow proposes values from their financial offers and waits for confirmation.
Flow writes the email with the quarter's figures. You open it in your email client and send it.
Every figure is calculated from your pursuits or from public procurement data, and Flow can answer questions about any of them.
Current win rate
Pipeline value
Bid pipeline
Submissions due
Team bid contribution
Buyer and competitor statistics
We set up pursuits from tenders you follow and ask Flow to summarise the numbers with your team.
Tenders you find in Discover become pursuits, and pursuits feed the win rate and pipeline in Insights.
The team overview shows awarded value this quarter, submissions due in the next 7 days, the current win rate, total and qualified pipeline value, the win rate by quarter, team bid contribution, the bid pipeline from new to won, and bids submitted against won.
From your pursuits: bids won against bids submitted. The figures are as accurate as the status and estimated value your team records on each pursuit.
Yes. Ask about your pipeline, deadlines or results in plain words. Flow reads your team's pursuits and answers in the conversation, with charts grounded in that data. It stays inside your team's data.
Yes. Flow reads contracting authority statistics and company statistics from public procurement data, including frequent CPV codes, CPV market share, regional coverage, main competitors and participation over time.
Flow produces PDF, Word and Excel files, and spreadsheets list their sources and assumptions. A scheduled task can summarise the numbers every week in a new thread. Flow drafts emails but does not send them.
Start free, record your pursuits and ask Flow to summarise the pipeline.